Press release · 6 nov. 2025
Neko Data Story: Repeat Scans Show Health Improvements
neko health
As part of our 2025 Data Story, we’ve released new results from our first 1,469 members who returned for a second full-body scan, approximately one year after their initial scan. The data shows measurable improvements in blood pressure, cholesterol, and blood sugar – offering early evidence that proactive tracking and personalised feedback can help people make meaningful changes to their health.
While this is not a scientific study with a control group, we believe it’s important to share our findings transparently and contribute to the broader knowledge of preventive healthcare and the real-world impact of early detection.
How the Data Was Collected
This report is based on members who completed two Neko body scans roughly one year apart. At each visit, we collected a consistent set of health measurements: blood pressure, cholesterol, blood sugar, body weight, and grip strength. For results measured on both sides of the body, such as blood pressure and grip strength, we used the higher value.
To determine whether a change between visits was meaningful, we compared results using established statistical tests to prove if it was significant. Only statistically significant changes were reported.
All scans were performed at Neko Health’s clinics in Stockholm.
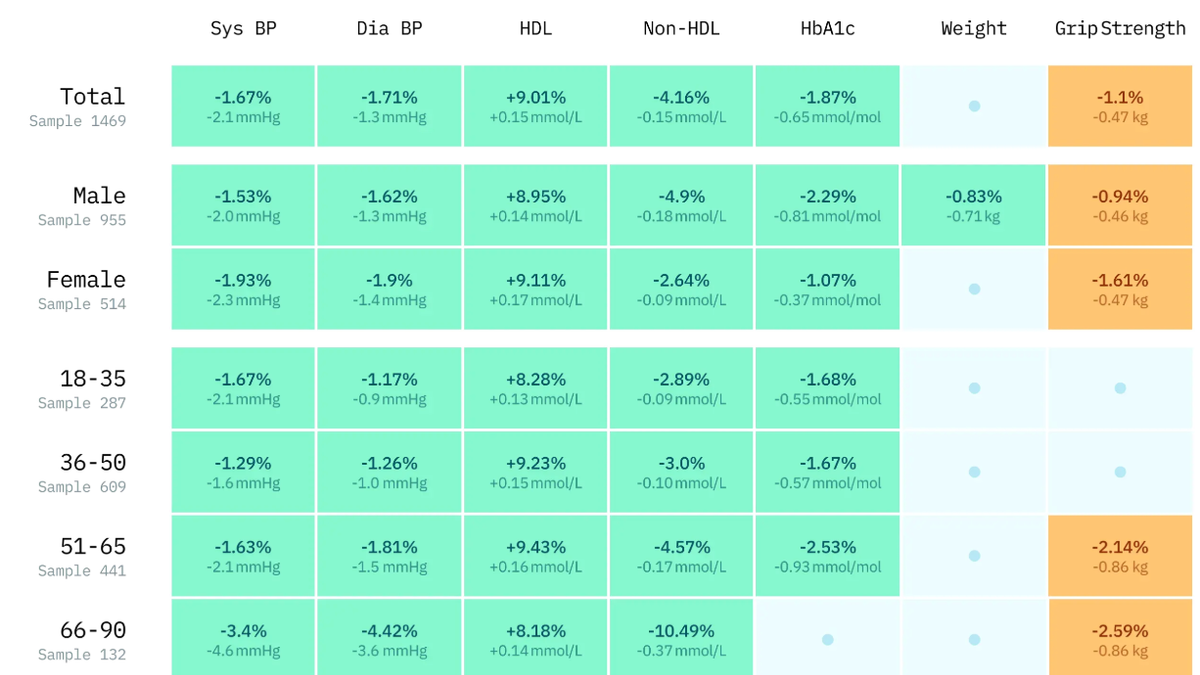
To understand patterns more clearly, we analysed results across three key groups:
- The general cohort: all members who returned for a second scan.
- The healthy cohort: members without particular chronic conditions, medications and abnormal values at their first scan.
- Chronic cohorts: with a focus on hypertension, prediabetes, and diabetes - the most common conditions in our dataset.
Other chronic conditions were also monitored but are not featured here due to limited sample sizes at this stage. As the dataset grows, we plan to share insights from these groups in future updates.
General Cohort: a shift towards higher protection
Across the full group of 1,469 members, we saw consistent improvements in blood pressure, cholesterol and blood sugar. Weight remained stable, while grip strength declined* – an effect believed to be due to a change in how the test was performed. Many members were either identified with chronic conditions or became aware of elevated risk levels at their first scan, prompting medical and behavioural changes before returning. Together, these shifts suggest a meaningful move toward better cardiovascular and metabolic health.
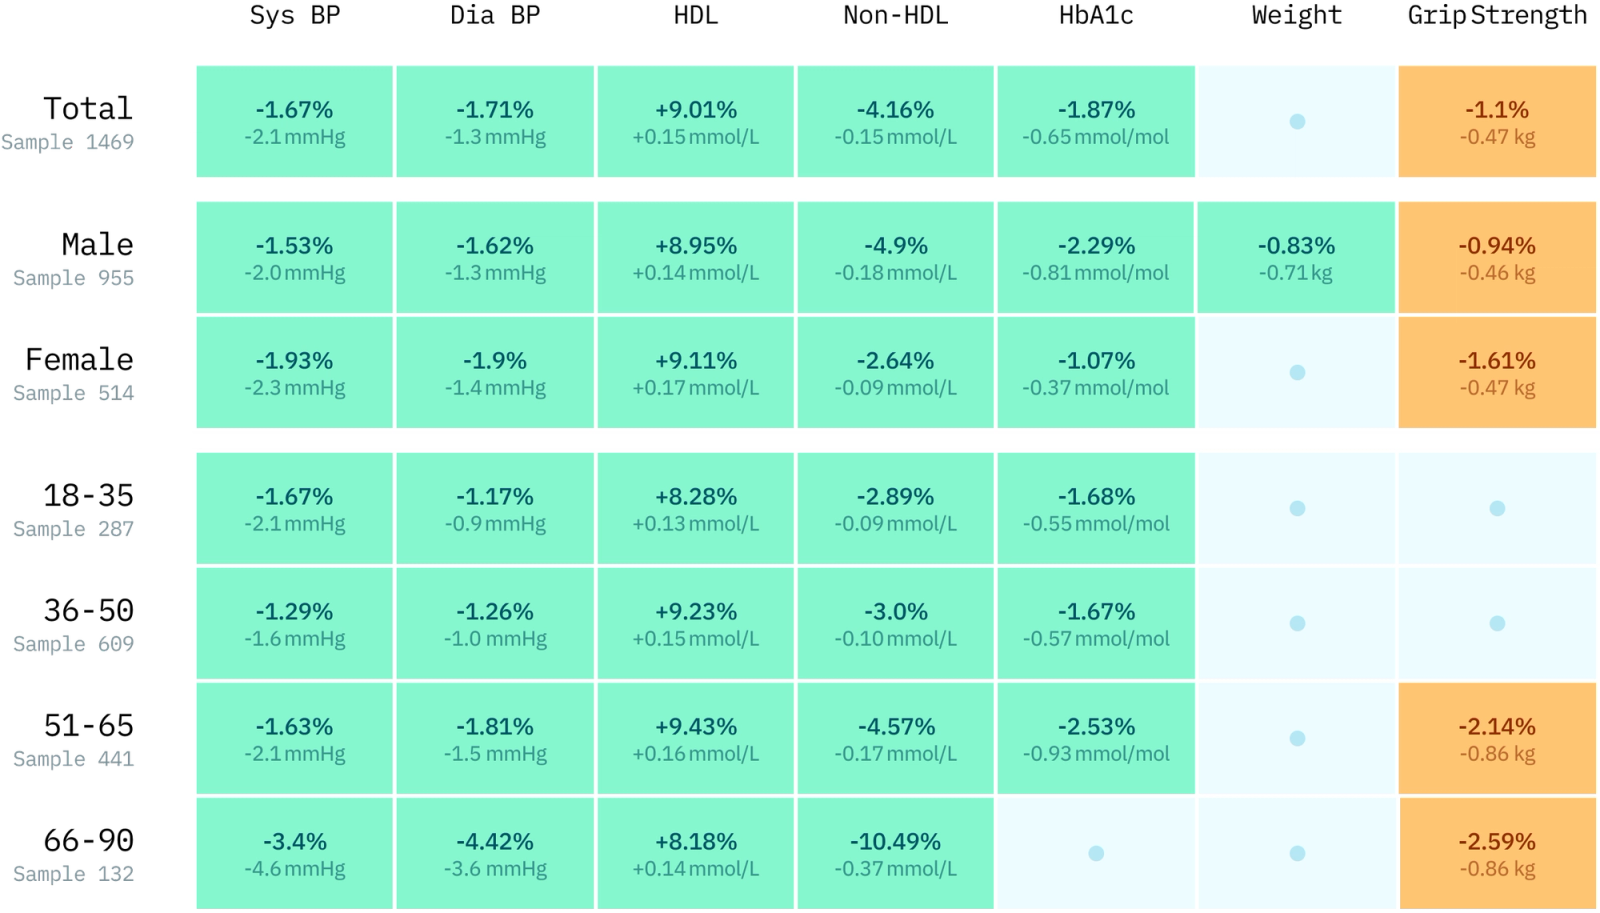
Healthy Cohort: Staying Well, Getting Better
This subgroup represents members who were already in good health at their first scan.
For this group, results were largely stable, with small improvements in blood sugar, cholesterol, and in some cases blood pressure. Weight remained stable, apart from a slight gain in the oldest subgroup. Grip strength followed the same declining trend as in the general cohort, which can largely be explained by a change in testing protocol.
These results underline what we believe is most important: to help people remain in good health. By providing reassurance, making small changes visible, and giving early signals if values start to drift, repeat scans help members maintain their health across the years.
Chronic Cohorts: Clear Improvements Where Risk is Highest
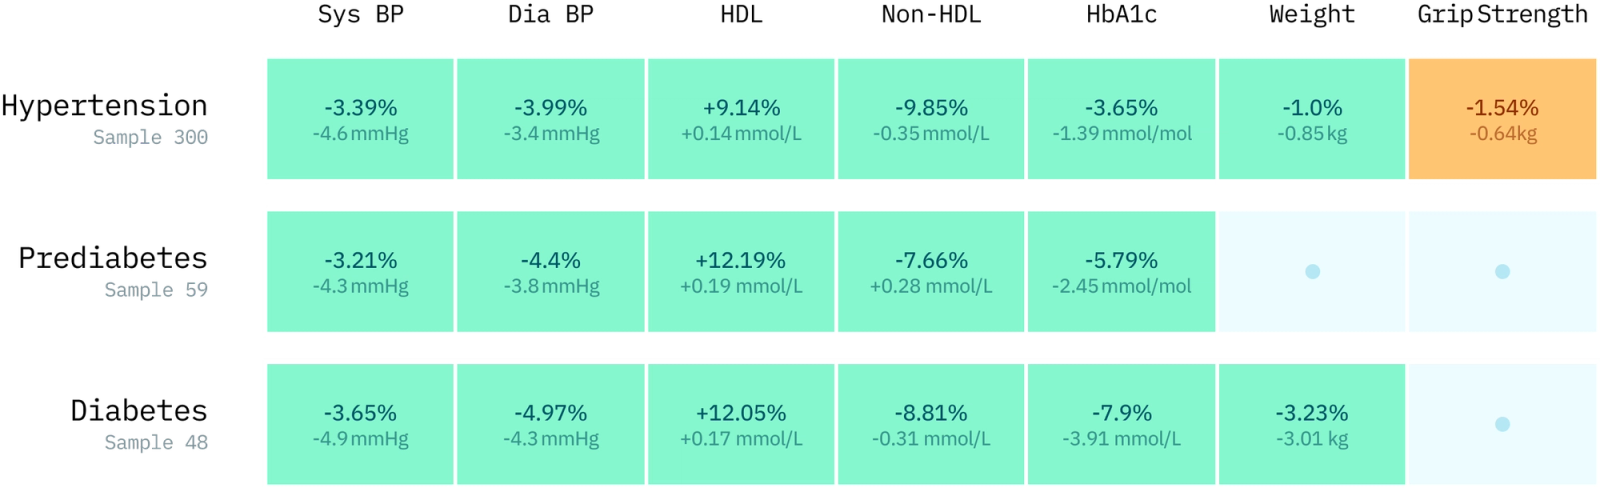
The strongest improvements came from members with hypertension, prediabetes, or diabetes - the most common chronic conditions in our dataset. These groups showed consistent decreases in blood pressure, cholesterol, and blood sugar between their first and second scans.
For many, the first scan represented the moment when an elevated risk or condition was first identified, which led to treatment initiation or lifestyle change before the second scan.
For others, the scans provided a way to track and optimise existing management. Members already on medication or under care were able to see whether their treatment was working effectively, and in some cases identify where there was room for further improvement.
Together, these results illustrate how repeat scans can fill critical gaps in care by making health status visible and trackable - supporting both the early detection of previously unknown conditions and the better management of existing ones.
Reflections
These early results offer measurable data suggesting that the Neko model works — not just in theory, but in practice. As more members continue their health journeys with Neko we aim towards continuing to monitor and support better health over time.
Footnotes
* Grip strength was previously measured mostly in a standing position and later in a strict sitting position. Research shows grip strength values are consistently higher when tested standing compared to sitting (e.g., Mathiowetz et al., J Hand Surg 1985; Roberts et al., Eur J Appl Physiol 2011). This methodological change likely accounts for the observed decline.
Neko Health Scan
1 hour | 2 750 kr